SmartLTV formula
A smart contract to automatically calculate Loan-To-Value ratios according to risk-related data feeds.
Disclaimer:
The Smart LTV formula and the data layer used with it are experimental and are published for research purposes only. The data is used by a testnet smart contract and may be incorrect, missing, or wrong altogether. Using the formula, its code, and the data associated with it can cause risk management flaws and might result in severe financial losses. Use at your own risk and for research purposes only. You can reach out to RiskDAO for any inquiries or suggestions to improve the code, the formula, the data, or anything else related to this paper.
Introduction
Determining the correct Loan-To-Value (LTV) of a collateral asset is crucial to balance the loan’s default risk and the usability of the lending platform.
This is done by running excessive daily simulations and integrating a domain specific knowledge.
In a new research paper, we try to find a simple “Uniswap-like” formula for the LTV ratio. We present a simple formula that can be calculated by a smart contract (e.g., when coupled with B.Protocol’s planned on-chain data oracle).
With the formula, one has to decide on a value of a Confidence level, instead of a value to the LTV. This process is more efficient as once the level is selected, the LTV ratio could change automatically based on the market conditions (volatility and liquidity).
Moreover, once such data is available on-chain (e.g., via B.Protocol oracle), it will be possible for a smart contract to automatically decide on the LTV ratio of assets, and change it dynamically over time. Hence, the formula can reduce a lot of future decision making overhead, and give rise to a more automated and permissionless lending market.
The formula can also be used as a ranking formula, comparing the different risks between different configurations and platforms. For example, a new platform can estimate the average confidence level of an existing project, and decide if they want to take similar or different risks with their assets. Existing platforms can give more transparency to their community about which asset configurations are currently less or more risky.
In the full paper we analyze the confidence level of the assets in Compound III USDC market.
The formula
Aiming for the simplest possible formula, we abstract smart contract security considerations, and assumptions on user behaviour. However, as mentioned above, formula has an adjustable confidence parameter that could compensate for these aspects.
At the core level, the goal of setting an LTV ratio that is smaller than 1, is to compensate for the potential price decrease during the liquidation process (which need not be in a single tx, and could take time).
For this purpose, we aim to answer the following question:
How much will the price decrease before a liquidation is fully executed?
This is a very open ended question, as even the size of the liquidation is unknown.
For this purpose, we make the following three assumptions:
There is a discrete basic time unit, and the price follows a log-normal random walk distribution. We note that in particular, there is an implicit assumption that a liquidation will not change the price of the asset, however, a different assumption could potentially be embedded at the confidence level factor.
DEX liquidity. We define liquidity as the total quantity that is available for sale with a given price slippage. We assume that every time the liquidity is depleted, it will be fully restored after a constant time interval T. This can be justified, e.g., by traders/bots arbitraging the existing DEX liquidity with Binance orderbook, and/or for additional liquidity to come from another chain (if the lending market is on an L2). As usual, the confidence parameter will also embed the confidence in this assumption.
Liquidation sizes. The size of liquidation that a lending market should be prepared for, is proportional to the total debt in the system. We note that in practice, the current user account composition also has a great effect on this parameter, however, as a design choice, we chose to abstract away the current user composition.
Given the above assumptions, the proposed formula is:

Where:
σ is the price volatility between the collateral and debt asset (normalized to the base asset price).
β is the liquidation bonus.
ℓ is the available dex liquidity with a slippage of β.
d is the borrow cap of the debt asset.
c is a confidence level factor. The higher c is, the odds for insolvency are decreasing.
We prove the correctness of the formula in the paper.
Experimental results
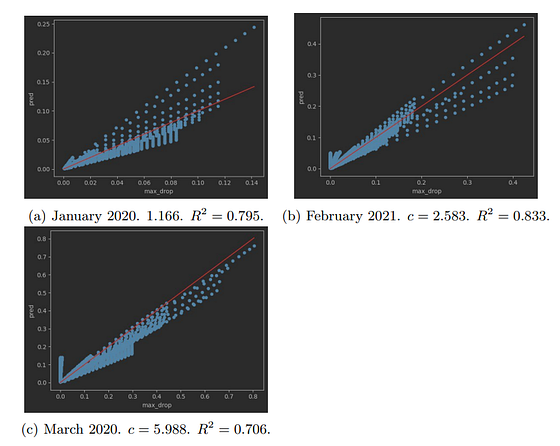
99.9\% of all DeFi liquidations are executed in a single transaction. And thus we take real liquidation data from Binance Futures ETH-USD pair. In order to test different volatility levels, we amplify the price changes and multiply them by a stretching constant that ranges between 0 and 2.
The most synthetic part in our experiments is the behavior of DEX liquidity. We follow the formula assumption that there is a fixed DEX liquidity size, which is restored every 30 minutes.
We take the 3 worst months (in terms of liquidations) in the history of Binance Futures, namely, January 2020, March 2020 and February 2021.
Having price trajectory and liquidation time and sizes in hand, we simulate the DEX liquidity, and the behavior of the liquidators. And keep track of the maximum price drop of an open liquidation.
The results are depicted below.

Last updated
Was this helpful?